
AN EVENTFUL WEEK
Date:
This article originally appeared in BloodHorse Daily on March 18th, 2019 .

All weeks are eventful, certainly for those of us who follow racing internationally, but it did seem like the past week was particularly eventful. There were a couple of races with great stories. Jumps racing for sure isn’t everybody’s cup of tea, but for those who do recognize it as now a kind of offshoot of flat racing, the four-day Cheltenham Festival, Mar. 12-15, can only be described as the jumps equivalent of Royal Ascot, minus the fancy gear. The total attendance over the four days was a massive 266,000, and happily the main reason is that it really is a festival of top-class horse racing.
The co-feature on the third day (Mar. 14) is the Ryanair Chase, known for its long-time sponsor, though technically it is known as the Festival Trophy. It’s run over 2m4½ furlongs, which is an intermediate distance, and it’s a little bit like the G1 Breeders’ Cup Dirt Mile in that it attracts horses who aren’t quite good enough or can’t stay the 3m2 furlongs of the Cheltenham Gold Cup. This year, 10-time Champion Jumps Trainer Paul Nicholls had what looked like a better prospect for the Gold Cup (Clan des Obeaux, who ultimately finished fifth), and decided to point his other possible Gold Cup horse, Frodon, a 7-year-old by a horse called Nickname, to the Ryanair, to be ridden as usual by the personable 23-year-old Bryony Frost.
I’m a degenerate handicapper, I admit it. I thought Frodon was a great bet at 7-1, so I am definitely talking through my pocket, but this was one of the best races I’ve seen in a very long time; if you haven’t seen it, go and watch it on YouTube. She went right to the front on him, he was harried the entire way, got passed by a horse on each side in the straight, and battled back to win by a narrow but decisive length and a quarter. I mean, these races take five minutes, and it was so exhilarating to watch. And the interviews afterwards were priceless; she is enthusiastic, bubbly, but eloquent, too, and emotional – she could explain how she felt, and it was captivating. Who wouldn’t love horse racing, if you saw that? – but that’s another issue; we’ll get to that in a moment.
The other great story this week was the win by the 3-year-old filly Mystic Journey in the inaugural running (therefore I think it’s not even a black-type race!) A$5-million All Star Mile at Flemington Race Course on Mar. 16. Fortunately for Mystic Journey she already had the black type, as two weeks previously she had become the first horse ever trained in Tasmania to win a G1 race when defeating colts in the G1 Australian Guineas (1600m), also at Flemington. The video of her ‘strapper’ and trainer on Twitter was priceless. Talk about cheering for the underdog, Mystic Journey was an $11,000 yearling from Tasmania, and now they’re talking about her as the new Winx. She gets a break now and will be pointed for one of Winx’s signature races, the prestigious 2040m G1 WS Cox Plate in October. She is from the second crop of Needs Further, a G3 winner over 1600m in Sydney by Encosta De Lago.
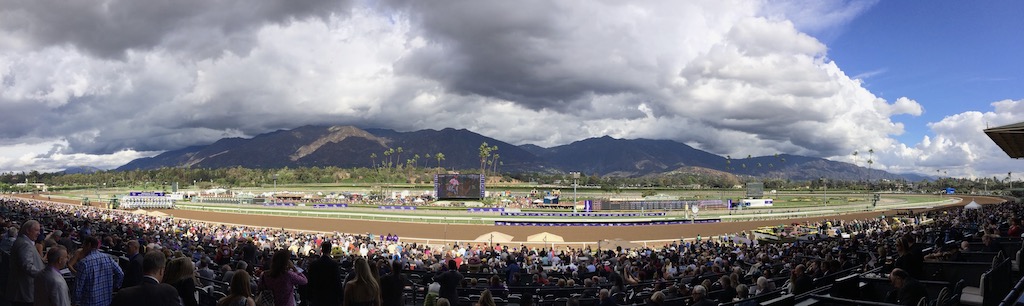
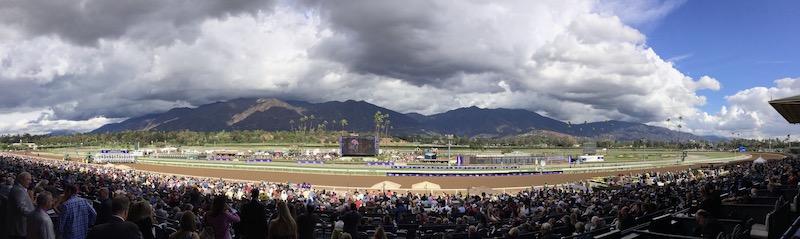
Those were the good news stories. The bad news of course are the 22 equine deaths at Santa Anita; the attendant terrible publicity for a business which is fragile anyway, at least in the U.S. The announcement of an agreement on Mar. 16 which will phase out Lasix use in California is very welcome news as it will bring California in line with IFHA rules, and will go a long way towards restoring international faith in the validity of California racing, anyhow – as long as they can dramatically reduce equine fatalities, which of course isn’t guaranteed by stopping Lasix use.
Though there will now be attempts by the Stronach tracks in other states to implement the same policies, and though it is commendable that after years of resistance, a powerful horsemen’s group like the TOC recognizes the time to act is now, the whole episode does illustrate how the thoroughbred racing business in America is profoundly compromised by fragmentation and the inability to assemble all the legitimate interest groups into a national governing body which can set policy. It has to now be obvious – you would think – to every head of every organization with initials that horse racing in the U.S. is a rudderless ship, and there needs to be a real effort, which should be taking place starting now, to create an effective national office which can speak with one voice and institute and enforce policy on which the constituent groups agree. Horse racing constitutionally has to be run by the states, but the time has come when everybody’s statutory fiefdoms have to come together to create a national office, or there is a very real possibility in another ten or fifteen years there will be no fiefdoms to administer. Let me reiterate: this is going to have to be done voluntarily, we as an industry have no power to mandate it.
And why should there be a national office with real teeth? Two reasons: one, it is the only way to reach and administer consensus within the industry; and two, all the competition operates this way, and it works. And by ‘all the competition’ I’m referring to competition for the entertainment dollar, because that’s what we are: a segment of the entertainment industry. We’re very good at being in competition with each other, but that’s only useful up to a point. In the bigger picture horse racing is competing for the entertainment and gambling dollar, and we are somewhere between severely and terminally handicapped by not only not speaking with one voice but worse, not acting with one policy.
OBS MARCH: SOME GOOD NEWS
This is the fifth year the OBS March 2-Year-Old Sale has been a two-day sale with a catalogue of around 600 horses. It’s also now the first 2-year-old in training sale so is watched even more carefully for market trends.
There were 577 two-year-olds catalogued to this year’s edition of the March sale, compared to 573 last year. In 2015 and 2016, the first two years of the new format, the number catalogued had been 610 and 613 respectively; only in 2017 had the number catalogued (677) deviated markedly from the plus-or-minus 600 range.
The fact that the number catalogued this year was virtually identical to 2018 does make year-to-year comparisons potentially more meaningful, and so it seems is the case this year, in two important, and linked, respects: first, the number (312, at last report) and percentage of the catalogue sold (54.0%) were up significantly from 2018; and second, the median was down by 24%, from $105,000 to $80,000.
But the two numbers are definitely connected, as OBS sales director Tod Wojciechowski was discussing with Ron Mitchell in the Blood-Horse Daily edition of March 14. Wojciechowski said 117 two-year-olds were listed sales for $50,000 and under, compared with 87 last year. That difference of 30 selling for roughly a third, or less, of the sales average, definitely figures to bring the average and median down. But a 9% increase in the clearance rate from the catalog – 54% versus 45% last year – is a big increase in a market in which it’s basically 50-50 or less, once a 2-year-old is catalogued, that it’s actually going to get sold. So that return to 54% is so welcome the consignors and sales company likely don’t mind too much if other metrics decline.
With 55 more 2-year-olds sold this year than last, the gross increased a modest 5%, from $42.2-million to $44,718,500, while the average dropped 13%, to $143,328, from last year’s $164,494. A total of 14 horses sold for $500,000+ versus 17 last year, but on the other hand they set a new record for a March 2-year-old ($2-million), and sold another, a Pioneerof The Nile colt, for $1.2-million.
Of the 25 sires which had one sell for, or averaged, $200,000 or more at the sale, 15 had either one or two horses sell, so 10 sires with three or more sold averaged over $200,000. Coolmore Ashford’s American Pharoah had the highest average of those ten, with three averaging $458,333, though he had originally had nine catalogued of which six went through the ring. Four other sires with their first 2-year-olds made this list. Darby Dan’s Tapiture, a winner of five Graded races (2 G2, 3 G3) who ran in 16 Graded races in 18 starts, rang up six six-figure sales at last year’s yearling sales, off his $7,500 stud fee; his four OBS March 2-year-olds averaged $285,000. Three Chimneys’ Palace Malice, the 2013 G1 Belmont S. and 2014 G1 Met Mile winner from Curlin’s first crop, had five average $268,000, including an $850,000 colt to Mike Ryan. Ocala Stud is pretty famous for getting sires started in Florida, such as Kantharos for example, and Adios Charlie a few years ago. Six 2-year-olds by their new sire The Big Beast, a G1-winning six- and seven-furlong horse by Yes It’s True (this is the purest surviving ‘sprinting’ Bold Ruler, via Is It True and Raja Baba), averaged $247,000 and included an $850,000 filly and a $450,000 colt. Finally, Gainesway’s Karakontie had three catalogued; all three sold, with a high of $365,000 and an average of $205,000.
Into Mischief had the highest average among the five sires with runners with three or more sold and a $200,000+ average, with seven sold, for an average of $297,857. Uncle Mo was next, with six sold for an average of $284,167, followed by: Super Saver (3/$273,333); Candy Ride (4/$249,750); and Flatter (3/$221,667).
For more articles by Bill Oppenheim, APEX ratings, and Brianne Stanley’s Weekly Sales Ticker, please visit www.billoppenheim.com
| SIRES with $200k+ AVERAGE, OBS MARCH | ||||||||||
|---|---|---|---|---|---|---|---|---|---|---|
| Sire | YOB | !st Fls | ST | Cat | Ring | Sold | US$ Gross | US$ Avg | € Avg | £ Avg |
| Tapit | 2001 | 2006 | USA | 4 | 1 | 1 | 2,000,000 | 2,000,000 | 1,778,568 | 1,521,028 |
| Pioneerof the Nile | 2006 | 2011 | USA | 1 | 1 | 1 | 1,200,000 | 1,200,000 | 1,067,141 | 912,617 |
| Speightstown | 1998 | 2006 | USA | 2 | 1 | 1 | 650,000 | 650,000 | 578,035 | 494,334 |
| Medaglia d'Oro | 1999 | 2006 | USA | 3 | 2 | 2 | 1,150,000 | 575,000 | 509,345 | 439,838 |
| Bernardini | 2003 | 2008 | USA | 5 | 2 | 2 | 1,115,000 | 557,500 | 495,776 | 423,987 |
| No Nay Never | 2011 | 2016 | IRE | 1 | 1 | 1 | 525,000 | 525,000 | 466,874 | 399,270 |
| American Pharoah | 2012 | 2017 | USA | 9 | 6 | 3 | 1,375,000 | 458,333 | 407,040 | 349,269 |
| Lemon Drop Kid | 1996 | 2002 | USA | 5 | 3 | 2 | 875,000 | 437,500 | 388,239 | 333,775 |
| More Than Ready | 1997 | 2002 | USA | 4 | 1 | 1 | 390,000 | 390,000 | 345,469 | 298,325 |
| Tale of the Cat | 1994 | 2000 | USA | 2 | 2 | 1 | 325,000 | 325,000 | 287,891 | 248,604 |
| Discreet Cat | 2003 | 2009 | JPN | 3 | 2 | 2 | 620,000 | 310,000 | 274,768 | 236,920 |
| Ghostzapper | 2000 | 2007 | USA | 3 | 1 | 1 | 300,000 | 300,000 | 265,745 | 229,481 |
| Into Mischief | 2005 | 2010 | USA | 14 | 9 | 7 | 2,085,000 | 297,857 | 264,313 | 227,248 |
| Tapiture | 2011 | 2017 | USA | 9 | 7 | 4 | 1,140,000 | 285,000 | 253,034 | 217,272 |
| Uncle Mo | 2008 | 2013 | USA | 11 | 7 | 6 | 1,705,000 | 284,167 | 252,127 | 216,850 |
| Super Saver | 2007 | 2012 | USA | 5 | 3 | 3 | 820,000 | 273,333 | 242,332 | 208,817 |
| Majestic City | 2009 | 2017 | USA | 2 | 1 | 1 | 270,000 | 270,000 | 240,107 | 205,339 |
| Palace Malice | 2010 | 2017 | USA | 13 | 6 | 5 | 1,340,000 | 268,000 | 237,538 | 204,826 |
| Include | 1997 | 2004 | USA | 1 | 1 | 1 | 250,000 | 250,000 | 222,321 | 190,129 |
| Candy Ride (ARG) | 1999 | 2006 | USA | 6 | 5 | 4 | 999,000 | 249,750 | 222,078 | 189,965 |
| The Big Beast | 2011 | 2017 | USA | 7 | 6 | 6 | 1,482,000 | 247,000 | 218,836 | 188,890 |
| Flatter | 1999 | 2005 | USA | 4 | 3 | 3 | 665,000 | 221,667 | 196,559 | 169,303 |
| Prospective | 2009 | 2015 | USA | 1 | 1 | 1 | 210,000 | 210,000 | 186,022 | 160,636 |
| Karakontie (JPN) | 2011 | 2017 | USA | 3 | 3 | 3 | 615,000 | 205,000 | 182,188 | 156,053 |
| Tonalist | 2011 | 2017 | USA | 2 | 2 | 1 | 200,000 | 200,000 | 177,164 | 152,987 |
| OBS MARCH SIRES, Avg <$200k, Alphabetically | ||||||||||
|---|---|---|---|---|---|---|---|---|---|---|
| Sire | YOB | 1st Fls | ST | Cat | Ring | Sold | US$ Gross | US$ Avg | € Avg | £ Avg |
| Adios Charlie | 2008 | 2013 | USA | 2 | 1 | 1 | 20,000 | 20,000 | 17,786 | 15,210 |
| Algorithms | 2009 | 2014 | USA | 4 | 4 | 3 | 400,000 | 133,333 | 118,173 | 101,910 |
| Alpha | 2009 | 2016 | USA | 3 | 2 | 1 | 18,000 | 18,000 | 16,007 | 13,689 |
| Amira's Prince (IRE) | 2009 | 2017 | USA | 1 | 1 | 1 | 40,000 | 40,000 | 35,433 | 30,597 |
| Animal Kingdom | 2008 | 2015 | USA | 1 | 1 | 1 | 45,000 | 45,000 | 39,862 | 34,422 |
| Bayern | 2011 | 2017 | USA | 7 | 5 | 4 | 467,000 | 116,750 | 103,419 | 89,306 |
| Bellamy Road | 2002 | 2008 | USA | 4 | 3 | 3 | 58,000 | 19,333 | 17,181 | 14,718 |
| Big Brown | 2005 | 2010 | USA | 1 | 1 | 1 | 40,000 | 40,000 | 35,433 | 30,597 |
| Big Drama | 2006 | 2013 | USA | 2 | 1 | 1 | 30,000 | 30,000 | 26,679 | 22,815 |
| Blame | 2006 | 2012 | USA | 4 | 1 | 1 | 100,000 | 100,000 | 88,582 | 76,494 |
| Bodemeister | 2009 | 2014 | USA | 6 | 4 | 3 | 185,000 | 61,667 | 54,805 | 46,943 |
| Brethren | 2008 | 2015 | USA | 1 | 1 | 1 | 60,000 | 60,000 | 53,357 | 45,631 |
| Broken Vow | 1997 | 2003 | USA | 1 | 1 | 1 | 16,000 | 16,000 | 14,229 | 12,168 |
| Cairo Prince | 2011 | 2016 | USA | 8 | 6 | 4 | 363,000 | 90,750 | 80,464 | 69,321 |
| Can the Man | 2011 | 2016 | USA | 2 | 1 | 1 | 4,000 | 4,000 | 3,543 | 3,060 |
| Carpe Diem | 2012 | 2017 | USA | 12 | 6 | 5 | 920,000 | 184,000 | 163,517 | 140,076 |
| Central Banker | 2010 | 2016 | USA | 3 | 2 | 1 | 47,000 | 47,000 | 41,633 | 35,952 |
| Chitu | 2011 | 2017 | USA | 5 | 4 | 3 | 120,000 | 40,000 | 35,502 | 30,509 |
| City Zip | 1998 | 2003 | USA | 5 | 3 | 3 | 350,000 | 116,667 | 103,750 | 88,727 |
| Colonel John | 2005 | 2011 | KOR | 2 | 2 | 2 | 75,000 | 37,500 | 33,218 | 28,685 |
| Commissioner | 2011 | 2017 | USA | 9 | 6 | 5 | 995,000 | 199,000 | 176,399 | 152,067 |
| Competitive Edge | 2012 | 2017 | USA | 12 | 11 | 9 | 737,000 | 81,889 | 72,648 | 62,500 |
| Constitution | 2011 | 2017 | USA | 8 | 6 | 5 | 792,000 | 158,400 | 140,487 | 120,945 |
| Creative Cause | 2009 | 2014 | USA | 3 | 1 | 1 | 32,000 | 32,000 | 28,457 | 24,336 |
| Cross Traffic | 2009 | 2016 | USA | 1 | 1 | 1 | 92,500 | 92,500 | 82,259 | 70,348 |
| Curlin | 2004 | 2010 | USA | 2 | 1 | 1 | 65,000 | 65,000 | 57,803 | 49,433 |
| Danza | 2011 | 2017 | USA | 2 | 2 | 1 | 50,000 | 50,000 | 44,291 | 38,247 |
| Daredevil | 2012 | 2017 | USA | 9 | 6 | 5 | 304,000 | 60,800 | 53,983 | 46,349 |
| Data Link | 2008 | 2015 | USA | 1 | 1 | 1 | 20,000 | 20,000 | 17,786 | 15,210 |
| Declaration of War | 2009 | 2015 | JPN | 6 | 3 | 2 | 57,000 | 28,500 | 25,345 | 21,675 |
| Distorted Humor | 1993 | 2000 | USA | 3 | 3 | 2 | 196,000 | 98,000 | 87,150 | 74,530 |
| Emcee | 2008 | 2015 | BRZ | 4 | 4 | 4 | 78,000 | 19,500 | 17,332 | 14,841 |
| Empire Maker | 2000 | 2005 | USA | 3 | 2 | 2 | 225,000 | 112,500 | 99,871 | 85,779 |
| Fast Anna | 2011 | 2017 | USA | 6 | 4 | 4 | 687,000 | 171,750 | 152,167 | 131,342 |
| Fed Biz | 2009 | 2016 | USA | 6 | 3 | 3 | 107,000 | 35,667 | 31,617 | 27,253 |
| First Dude | 2007 | 2013 | USA | 5 | 3 | 1 | 100,000 | 100,000 | 88,928 | 76,051 |
| First Samurai | 2003 | 2008 | USA | 3 | 3 | 3 | 117,000 | 39,000 | 34,659 | 29,690 |
| Forty Tales | 2010 | 2015 | USA | 2 | 1 | 1 | 80,000 | 80,000 | 70,865 | 61,195 |
| Freud | 1998 | 2003 | USA | 2 | 1 | 1 | 130,000 | 130,000 | 115,156 | 99,442 |
| Friend Or Foe | 2007 | 2014 | USA | 1 | 1 | 1 | 10,000 | 10,000 | 8,893 | 7,605 |
| Fury Kapcori | 2010 | 2017 | USA | 3 | 3 | 2 | 47,000 | 23,500 | 20,817 | 17,976 |
| Gemologist | 2009 | 2014 | USA | 2 | 1 | 1 | 20,000 | 20,000 | 17,716 | 15,299 |
| Girolamo | 2006 | 2013 | KOR | 2 | 2 | 2 | 65,000 | 32,500 | 28,850 | 24,783 |
| Golden Ticket | 2009 | 2017 | USA | 1 | 1 | 1 | 25,000 | 25,000 | 22,232 | 19,013 |
| Goldencents | 2010 | 2016 | USA | 9 | 8 | 4 | 457,000 | 114,250 | 101,205 | 87,394 |
| Gone Astray | 2006 | 2013 | USA | 1 | 1 | 1 | 30,000 | 30,000 | 26,575 | 22,948 |
| Graydar | 2009 | 2015 | USA | 3 | 2 | 2 | 55,000 | 27,500 | 24,455 | 20,914 |
| Hard Spun | 2004 | 2009 | USA | 4 | 4 | 2 | 280,000 | 140,000 | 124,500 | 106,472 |
| Haynesfield | 2006 | 2013 | KSA | 1 | 1 | 1 | 95,000 | 95,000 | 84,153 | 72,669 |
| Honor Code | 2011 | 2017 | USA | 4 | 3 | 2 | 185,000 | 92,500 | 82,085 | 70,569 |
| Ice Box | 2007 | 2013 | USA | 2 | 2 | 2 | 107,000 | 53,500 | 47,455 | 40,842 |
| Jack Milton | 2010 | 2017 | USA | 2 | 2 | 1 | 30,000 | 30,000 | 26,679 | 22,815 |
| Japan | 2012 | 2017 | USA | 1 | 1 | 1 | 32,000 | 32,000 | 28,457 | 24,336 |
| Jersey Town | 2006 | 2014 | USA | 3 | 2 | 2 | 35,000 | 17,500 | 15,562 | 13,309 |
| Jimmy Creed | 2009 | 2015 | USA | 4 | 2 | 1 | 65,000 | 65,000 | 57,803 | 49,433 |
| Justin Phillip | 2008 | 2015 | USA | 6 | 5 | 4 | 685,000 | 171,250 | 152,290 | 130,238 |
| Kantharos | 2008 | 2012 | USA | 8 | 6 | 6 | 736,000 | 122,667 | 109,002 | 93,397 |
| Khozan | 2012 | 2017 | USA | 6 | 6 | 3 | 129,000 | 43,000 | 38,098 | 32,882 |
| Kitten's Joy | 2001 | 2007 | USA | 2 | 2 | 2 | 280,000 | 140,000 | 124,500 | 106,472 |
| Lea | 2009 | 2017 | USA | 4 | 2 | 1 | 65,000 | 65,000 | 57,578 | 49,721 |
| Liaison | 2009 | 2015 | USA | 2 | 2 | 1 | 10,000 | 10,000 | 8,858 | 7,649 |
| Liam's Map | 2011 | 2017 | USA | 3 | 2 | 2 | 155,000 | 77,500 | 68,772 | 59,128 |
| Lookin At Lucky | 2007 | 2012 | USA | 3 | 3 | 2 | 175,000 | 87,500 | 77,509 | 66,932 |
| Macho Uno | 1998 | 2005 | USA | 1 | 1 | 1 | 4,000 | 4,000 | 3,543 | 3,060 |
| Maclean's Music | 2008 | 2014 | USA | 6 | 5 | 3 | 295,000 | 98,333 | 87,175 | 75,130 |
| Malibu Moon | 1997 | 2001 | USA | 9 | 8 | 5 | 830,000 | 166,000 | 147,295 | 126,661 |
| Medal Count | 2011 | 2017 | USA | 1 | 1 | 1 | 45,000 | 45,000 | 40,018 | 34,223 |
| Midshipman | 2006 | 2012 | USA | 3 | 2 | 1 | 77,000 | 77,000 | 68,475 | 58,560 |
| Mineshaft | 1999 | 2005 | USA | 7 | 4 | 4 | 585,000 | 146,250 | 129,581 | 111,833 |
| Mission Impazible | 2007 | 2014 | USA | 4 | 3 | 2 | 85,000 | 42,500 | 37,734 | 32,399 |
| Mr Speaker | 2011 | 2017 | USA | 4 | 4 | 3 | 340,000 | 113,333 | 100,537 | 86,508 |
| Mucho Macho Man | 2008 | 2016 | USA | 3 | 2 | 1 | 100,000 | 100,000 | 88,582 | 76,494 |
| Munnings | 2006 | 2012 | USA | 8 | 3 | 3 | 290,000 | 96,667 | 85,964 | 73,516 |
| New Year's Day | 2011 | 2015 | BRZ | 3 | 2 | 2 | 89,500 | 44,750 | 39,795 | 34,033 |
| Normandy Invasion | 2010 | 2017 | USA | 2 | 1 | 1 | 100,000 | 100,000 | 88,928 | 76,051 |
| Orb | 2010 | 2015 | USA | 3 | 3 | 3 | 330,000 | 110,000 | 97,532 | 84,025 |
| Overdriven | 2009 | 2014 | USA | 1 | 1 | 1 | 20,000 | 20,000 | 17,786 | 15,210 |
| Palace | 2009 | 2017 | USA | 5 | 2 | 2 | 195,000 | 97,500 | 86,705 | 74,150 |
| Paynter | 2009 | 2015 | USA | 3 | 3 | 3 | 315,000 | 105,000 | 93,202 | 80,075 |
| Race Day | 2011 | 2017 | USA | 3 | 3 | 3 | 325,000 | 108,333 | 96,143 | 82,640 |
| Run Away and Hide | 2006 | 2010 | USA | 1 | 1 | 1 | 100,000 | 100,000 | 88,582 | 76,494 |
| Secret Circle | 2009 | 2017 | USA | 4 | 2 | 1 | 30,000 | 30,000 | 26,575 | 22,948 |
| Seek Again | 2010 | 2017 | ARG | 1 | 1 | 1 | 55,000 | 55,000 | 48,911 | 41,828 |
| Shackleford | 2008 | 2014 | USA | 4 | 2 | 1 | 67,000 | 67,000 | 59,582 | 50,954 |
| Shakin It Up | 2010 | 2016 | USA | 2 | 2 | 2 | 155,000 | 77,500 | 68,920 | 58,940 |
| Sky Kingdom | 2009 | 2017 | USA | 5 | 3 | 2 | 132,000 | 66,000 | 58,464 | 50,486 |
| Sky Mesa | 2000 | 2005 | USA | 3 | 2 | 2 | 220,000 | 110,000 | 97,821 | 83,657 |
| Soldat | 2008 | 2015 | USA | 2 | 1 | 1 | 25,000 | 25,000 | 22,145 | 19,123 |
| Stay Thirsty | 2008 | 2014 | USA | 2 | 2 | 2 | 102,000 | 51,000 | 45,315 | 38,835 |
| Street Boss | 2004 | 2010 | USA | 5 | 4 | 3 | 407,000 | 135,667 | 120,372 | 103,526 |
| Strong Mandate | 2011 | 2016 | USA | 3 | 3 | 3 | 284,500 | 94,833 | 84,334 | 72,122 |
| Summer Front | 2009 | 2017 | USA | 5 | 2 | 1 | 130,000 | 130,000 | 115,156 | 99,442 |
| Take Charge Indy | 2009 | 2015 | KOR | 5 | 4 | 3 | 157,000 | 52,333 | 46,539 | 39,800 |
| Temple City | 2005 | 2012 | USA | 2 | 2 | 2 | 70,000 | 35,000 | 31,021 | 26,751 |
| Teuflesberg | 2004 | 2009 | USA | 1 | 1 | 1 | 80,000 | 80,000 | 71,143 | 60,841 |
| The Factor | 2008 | 2014 | USA | 9 | 8 | 6 | 605,000 | 100,833 | 89,586 | 76,792 |
| Tiznow | 1997 | 2003 | USA | 6 | 6 | 6 | 734,000 | 122,333 | 108,642 | 93,223 |
| Twirling Candy | 2007 | 2013 | USA | 6 | 5 | 3 | 220,000 | 73,333 | 65,214 | 55,771 |
| Uncaptured | 2010 | 2016 | USA | 11 | 8 | 6 | 456,000 | 76,000 | 67,472 | 57,943 |
| Union Rags | 2009 | 2014 | USA | 10 | 5 | 3 | 503,000 | 167,667 | 148,522 | 128,254 |
| Verrazano | 2010 | 2016 | USA | 6 | 4 | 4 | 395,000 | 98,750 | 87,652 | 75,311 |
| Violence | 2010 | 2015 | USA | 7 | 4 | 4 | 320,000 | 80,000 | 70,909 | 61,140 |
| Wicked Strong | 2011 | 2017 | USA | 12 | 9 | 7 | 758,000 | 108,286 | 96,277 | 82,378 |
| Will Take Charge | 2010 | 2016 | USA | 6 | 4 | 1 | 80,000 | 80,000 | 70,865 | 61,195 |
| Zivo | 2009 | 2017 | USA | 1 | 1 | 1 | 10,000 | 10,000 | 8,893 | 7,605 |
| OBS MARCH, SIRES with 1ST 2YO'S 2019 | ||||||||||
|---|---|---|---|---|---|---|---|---|---|---|
| Sire | YOB | 1st Fls | ST | Cat | Ring | Sold | US$ Gross | US$ Avg | € Avg | £ Avg |
| American Pharoah | 2012 | 2017 | USA | 9 | 6 | 3 | 1,375,000 | 458,333 | 407,040 | 349,269 |
| Tapiture | 2011 | 2017 | USA | 9 | 7 | 4 | 1,140,000 | 285,000 | 253,034 | 217,272 |
| Majestic City | 2009 | 2017 | USA | 2 | 1 | 1 | 270,000 | 270,000 | 240,107 | 205,339 |
| Palace Malice | 2010 | 2017 | USA | 13 | 6 | 5 | 1,340,000 | 268,000 | 237,538 | 204,826 |
| The Big Beast | 2011 | 2017 | USA | 7 | 6 | 6 | 1,482,000 | 247,000 | 218,836 | 188,890 |
| Karakontie (JPN) | 2011 | 2017 | USA | 3 | 3 | 3 | 615,000 | 205,000 | 182,188 | 156,053 |
| Tonalist | 2011 | 2017 | USA | 2 | 2 | 1 | 200,000 | 200,000 | 177,164 | 152,987 |
| Commissioner | 2011 | 2017 | USA | 9 | 6 | 5 | 995,000 | 199,000 | 176,399 | 152,067 |
| Carpe Diem | 2012 | 2017 | USA | 12 | 6 | 5 | 920,000 | 184,000 | 163,517 | 140,076 |
| Fast Anna | 2011 | 2017 | USA | 6 | 4 | 4 | 687,000 | 171,750 | 152,167 | 131,342 |
| Constitution | 2011 | 2017 | USA | 8 | 6 | 5 | 792,000 | 158,400 | 140,487 | 120,945 |
| Summer Front | 2009 | 2017 | USA | 5 | 2 | 1 | 130,000 | 130,000 | 115,156 | 99,442 |
| Bayern | 2011 | 2017 | USA | 7 | 5 | 4 | 467,000 | 116,750 | 103,419 | 89,306 |
| Mr Speaker | 2011 | 2017 | USA | 4 | 4 | 3 | 340,000 | 113,333 | 100,537 | 86,508 |
| Race Day | 2011 | 2017 | USA | 3 | 3 | 3 | 325,000 | 108,333 | 96,143 | 82,640 |
| Wicked Strong | 2011 | 2017 | USA | 12 | 9 | 7 | 758,000 | 108,286 | 96,277 | 82,378 |
| Normandy Invasion | 2010 | 2017 | USA | 2 | 1 | 1 | 100,000 | 100,000 | 88,928 | 76,051 |
| Palace | 2009 | 2017 | USA | 5 | 2 | 2 | 195,000 | 97,500 | 86,705 | 74,150 |
| Honor Code | 2011 | 2017 | USA | 4 | 3 | 2 | 185,000 | 92,500 | 82,085 | 70,569 |
| Competitive Edge | 2012 | 2017 | USA | 12 | 11 | 9 | 737,000 | 81,889 | 72,648 | 62,500 |
| Liam's Map | 2011 | 2017 | USA | 3 | 2 | 2 | 155,000 | 77,500 | 68,772 | 59,128 |
| Sky Kingdom | 2009 | 2017 | USA | 5 | 3 | 2 | 132,000 | 66,000 | 58,464 | 50,486 |
| Lea | 2009 | 2017 | USA | 4 | 2 | 1 | 65,000 | 65,000 | 57,578 | 49,721 |
| Daredevil | 2012 | 2017 | USA | 9 | 6 | 5 | 304,000 | 60,800 | 53,983 | 46,349 |
| Seek Again | 2010 | 2017 | ARG | 1 | 1 | 1 | 55,000 | 55,000 | 48,911 | 41,828 |
| Danza | 2011 | 2017 | USA | 2 | 2 | 1 | 50,000 | 50,000 | 44,291 | 38,247 |
| Medal Count | 2011 | 2017 | USA | 1 | 1 | 1 | 45,000 | 45,000 | 40,018 | 34,223 |
| Khozan | 2012 | 2017 | USA | 6 | 6 | 3 | 129,000 | 43,000 | 38,098 | 32,882 |
| Chitu | 2011 | 2017 | USA | 5 | 4 | 3 | 120,000 | 40,000 | 35,502 | 30,509 |
| Amira's Prince (IRE) | 2009 | 2017 | USA | 1 | 1 | 1 | 40,000 | 40,000 | 35,433 | 30,597 |
| Japan | 2012 | 2017 | USA | 1 | 1 | 1 | 32,000 | 32,000 | 28,457 | 24,336 |
| Jack Milton | 2010 | 2017 | USA | 2 | 2 | 1 | 30,000 | 30,000 | 26,679 | 22,815 |
| Secret Circle | 2009 | 2017 | USA | 4 | 2 | 1 | 30,000 | 30,000 | 26,575 | 22,948 |
| Golden Ticket | 2009 | 2017 | USA | 1 | 1 | 1 | 25,000 | 25,000 | 22,232 | 19,013 |
| Fury Kapcori | 2010 | 2017 | USA | 3 | 3 | 2 | 47,000 | 23,500 | 20,817 | 17,976 |
| Zivo | 2009 | 2017 | USA | 1 | 1 | 1 | 10,000 | 10,000 | 8,893 | 7,605 |